Application Insights
This feature is available in DotVVM 1.1.5 and higher.
Application Insights is a service for web developers which helps to monitor a live web application. It automatically collects issues and telemetry of the application and sends them to the Microsoft Azure portal where the information can be analyzed.
DotVVM supports this service and tracks some additional telemetry which it collects during the processing of a HTTP request.
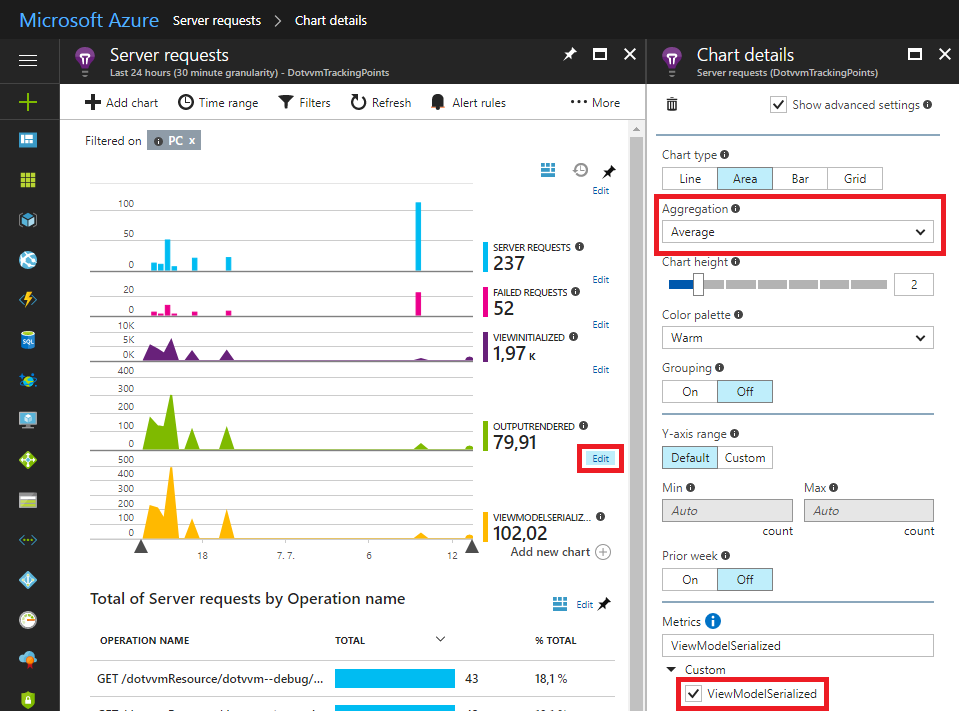
You can display the collected DotVVM telemetry by editing any chart in Server request tab. You can also choose which metrics you want to track in the metrics tab under Custom drop down menu. You can also aggregate the data.
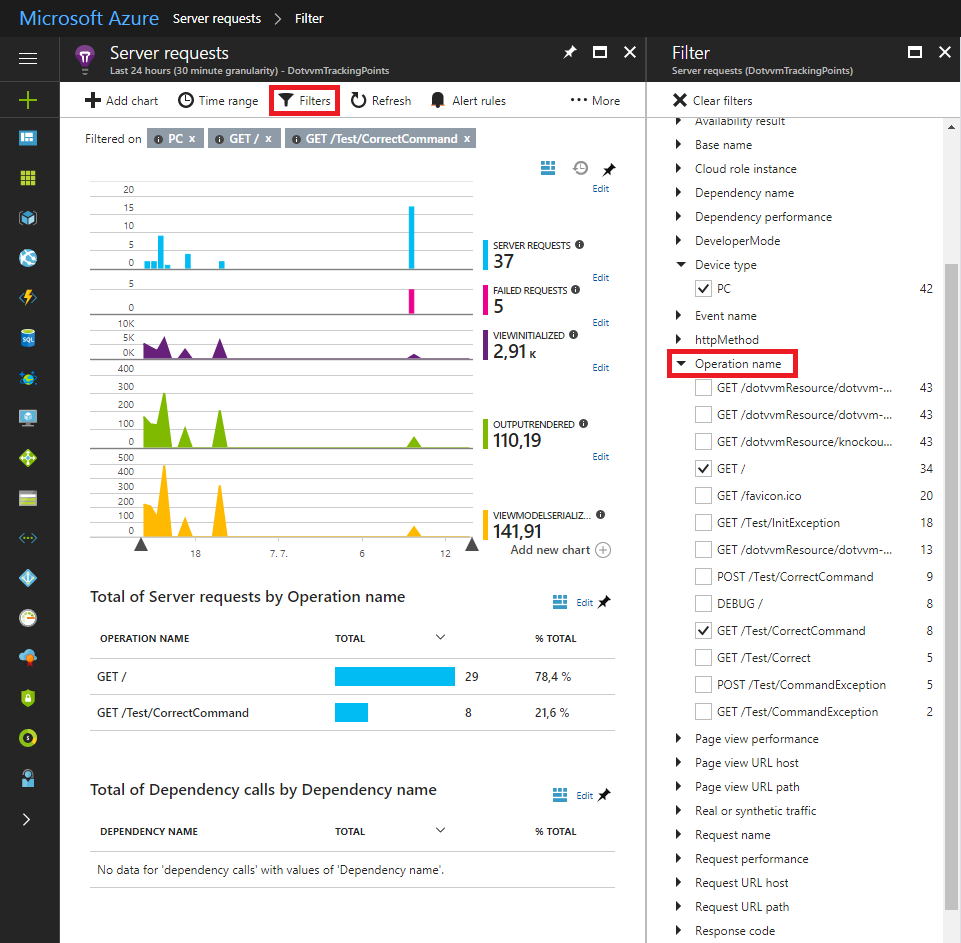
It is also possible to filter this data by the name of the operation:
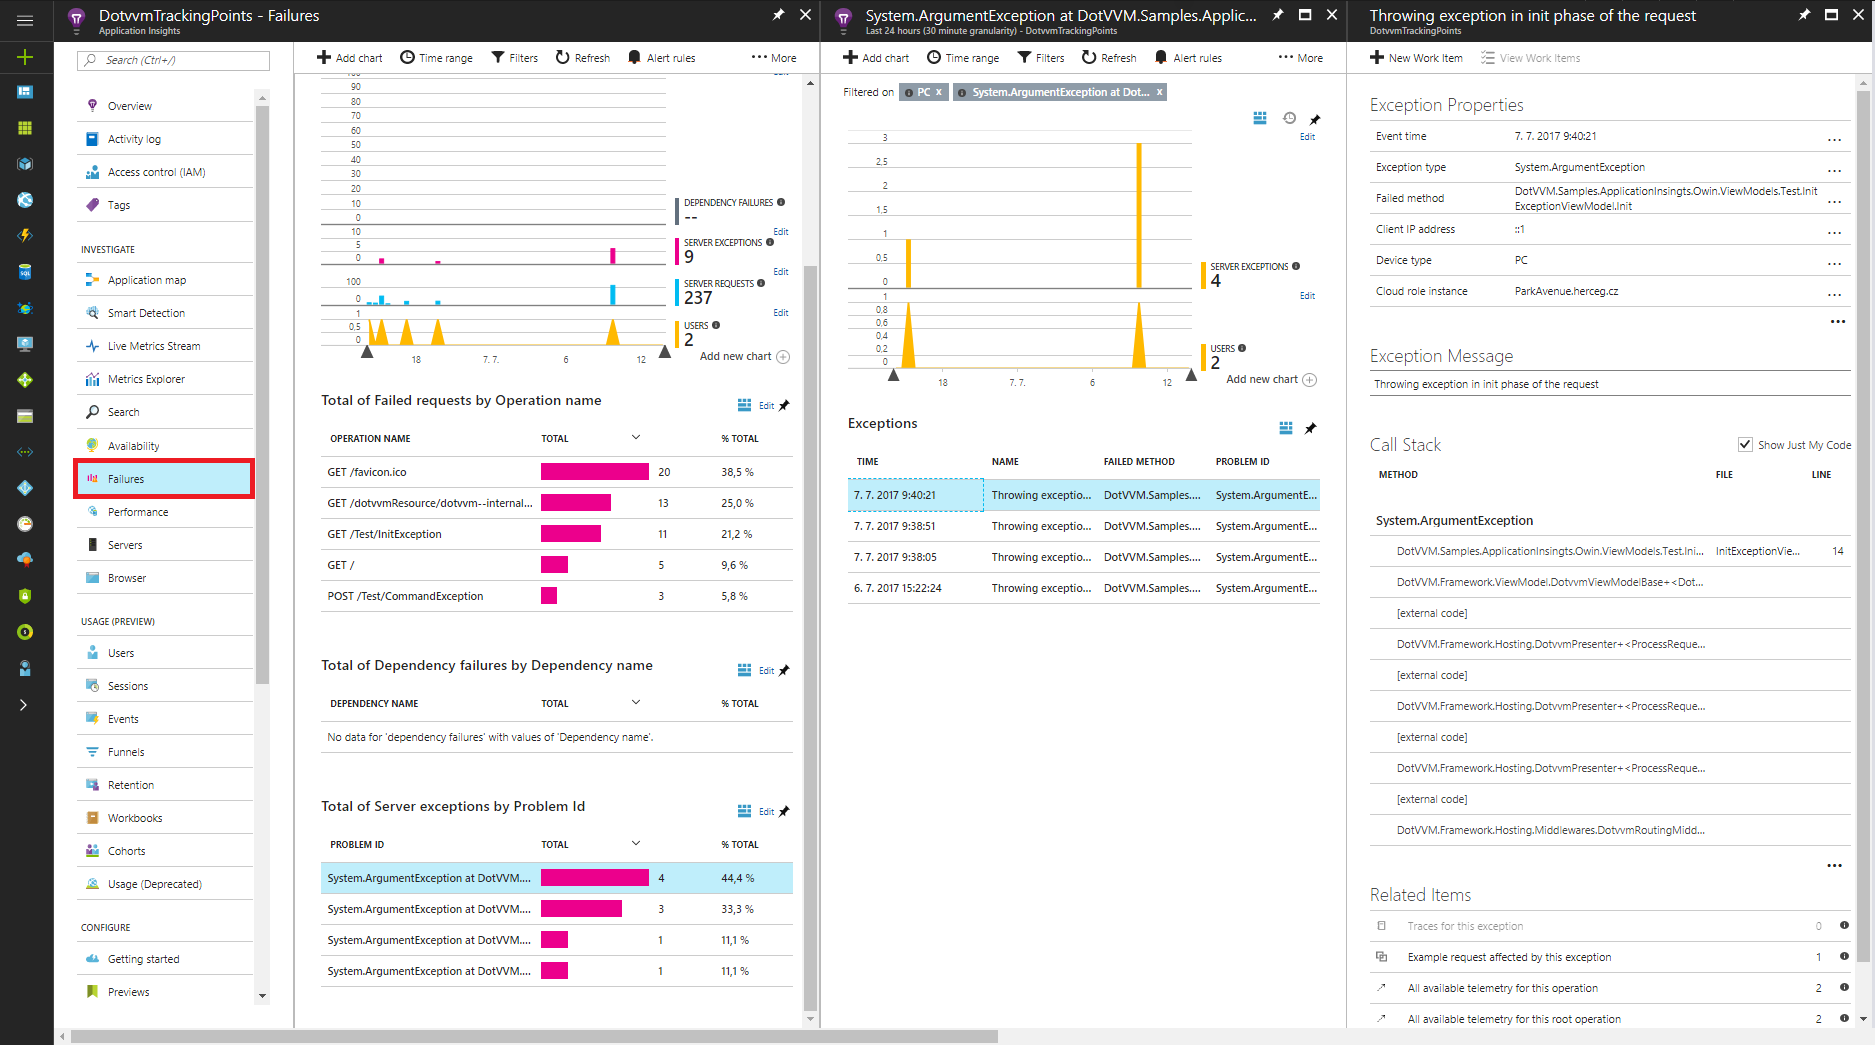
Additionally, you can analyze exceptions that were thrown in your web application:
Getting started
In order to view telemetry data in Microsoft Azure portal you need to create a Microsoft Azure resource. This can be done either through IDE or manually.
The process of creating a new Microsoft Azure resource is described in Create an Application Insights resource page.
In both ASP.NET Core and OWIN, you can use the ApplicationInsightJavascript control, which renders the Application Insight javascript snippet to do the tracing on client side. According to the official documentation, it should be placed just before </head> tag:
<dot:ApplicationInsightsJavascript />
OWIN version additionally contains the EnableAuthSnippet property. In ASP.NET Core web apps, this value is taken from ApplicationInsightsServiceOptions.
ASP.NET Core
You can add Application Insights to an ASP.NET Core project using the Visual Studio Solution Explorer window, or manually.
Follow this guide: Application Insights for ASP.NET Core to add Application Insights in Visual Studio Solution Explorer.
To install Application Insights in your ASP.NET Core project manually, you need to add Microsoft.ApplicationInsights.AspNetCore NuGet package dependency. In order to see the telemetry data in Microsoft Azure resource, you need to add the Instrumentation key to the appsettings.json file. You can find this key in the Overview tab of your Microsoft Azure resource. After that, you need to add instrumentation code to the Startup.cs class in you project.
To access more information about the Application Insights configuration in ASP.NET Core project see the Getting Started with Application Insights for ASP.NET Core page.
Now run the following command in the Package Manager Console window:
Install-Package DotVVM.Tracing.ApplicationInsights.AspNetCore
And finally, register the DotVVM tracking reporter in the ConfigureServices method this way:
services.AddDotVVM(options =>
{
    options.AddApplicationInsightsTracing();
});
OWIN
First, you need to add Application Insights into your ASP.NET project. You can do this in the Visual Studio Solution Explorer.
Follow this guide: Set up Application Insights for your ASP.NET website to add Applitaction Insights into your project.
After that, run the following command in the Package Manager Console:
Install-Package ApplicationInsights.OwinExtensions
Then, follow the steps from the Application Insights OWIN extensions documentation to make the Application Insights tracking working.
After you have updated the ApplicationInsights.config file, run the following command in the Package Manager Console window:
Install-Package DotVVM.Tracing.ApplicationInsights.Owin
And finally, register the DotVVM tracking reporter in the ConfigureServices method this way:
var dotvvmConfiguration = app.UseDotVVM<DotvvmStartup>(applicationPhysicalPath, options: options =>
{
    options.AddApplicationInsightsTracing();
});
Thanks to this, you will be able to see more detailed metrics for DotVVM requests.