MiniProfiler
MiniProfiler is a library and UI for profiling your application. By letting you see where your time is spent, which queries are run, and any other custom timings you want to add. It helps you debug issues and optimize performance.
MiniProfiler was designed by the team at Stack Overflow and is extensively used in production by their team.
DotVVM supports this library and tracks some additional metrics which it collects during the processing of an HTTP request.
Configure MiniProfiler
- Run the following commands in the Package Manager Console window:
Install-Package MiniProfiler.AspNetCore.Mvc
Install-Package DotVVM.Tracing.MiniProfiler.AspNetCore
- Next, you can register the MiniProfiler integration into DotVVM request tracing in the
IDotvvmServiceConfiguratorthis way:
public void ConfigureServices(IDotvvmServiceCollection options)
{
    options.AddMiniProfilerEventTracing();
}
- As the last step, you need to add the MiniProfiler services in the
ConfigureServicesmethod and the Miniprofiler middleware beforeapp.UseDotVVM<DotvvmStartup>():
public void ConfigureServices(IServiceCollection services)
{
    ...
    services.AddMemoryCache();
    services.AddMiniProfiler(options =>
    {
        options.RouteBasePath = "/profiler";
    });
}

public void Configure(IApplicationBuilder app)
{
    ...
    app.UseMiniProfiler();
    app.UseDotVVM<DotvvmStartup>();
}
To see it in action, you can simply navigate to ~/profiler/results-index and view profiled HTTP requests.
Check out the sample application to show how MiniProfiler can be used.
You can find the details for extended configuration in the MiniProfiler documentation.
MiniProfiler is also capable of profiling other 3rd party services, e.g. Entity Framework, Entity Framework Core, Redis, and more.
View results
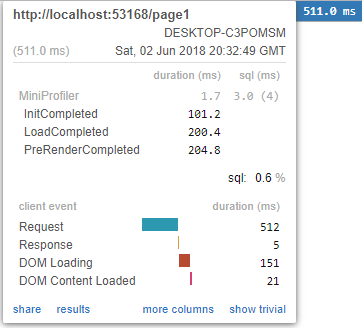
For both ASP.NET Core and OWIN, you can use the MiniProfilerWidget, which is a DotVVM control with several options (MaxTraces, Position, StartHidden, etc.):
<dot:MiniProfilerWidget Position="Right" ShowTrivial="true" StartHidden="true" />
You can display the collected DotVVM metrics by adding the MiniProfiler Widget to a DOTHTML page:
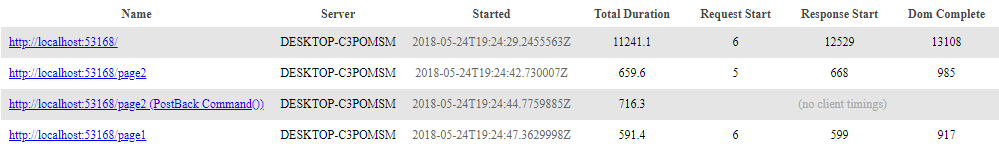
It is also possible to view the data traced in previous HTTP requests:
Profiling your own code
You can easily profile your code in order to measure the performance.
using (MiniProfiler.Current.Step("GetOrder"))
{
    return orderRepository.Get();
}
See the Profile code section in MiniProfiler documentation for more info.